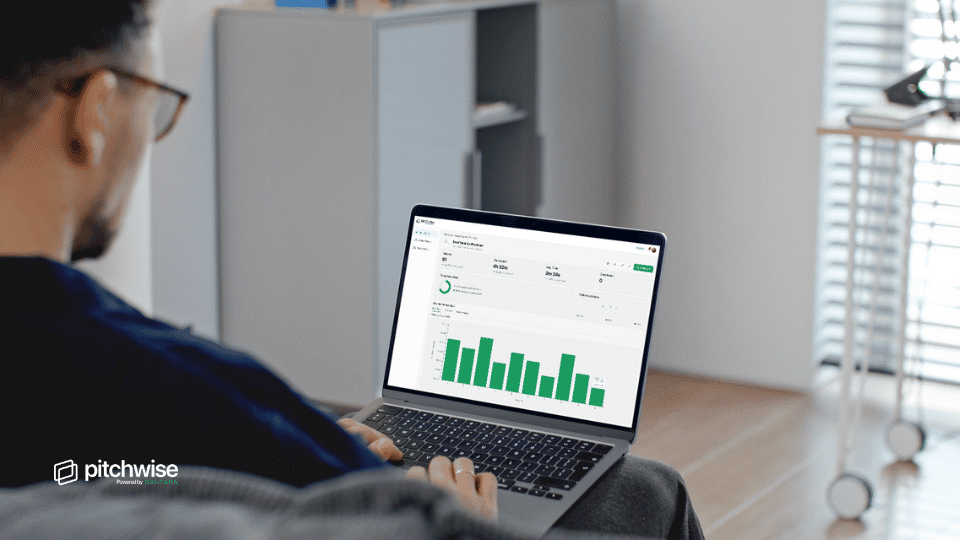
You can see that an investor spent eleven minutes in your deck. What you cannot tell without slide-level data is whether they spent ten of those minutes on the financials or whether they closed the tab on slide three and left the browser open.
Slide-level analytics turns an open notification into a map. This article explains each metric, what it signals at the individual slide level, and how to use it to improve the deck before your next follow-up.
What slide-level analytics actually measure
Most pitch deck tracking tools that offer slide-level data measure three things per slide: time spent, drop-off rate, and return visits to that specific slide. Some also capture the sequence in which slides were viewed, which is different from the order they appear in the deck.
- Time on slide: how many seconds the viewer spent on a given page before moving forward or closing
- Drop-off: the percentage of viewers who exit the deck on or immediately after a given slide
- Slide return rate: how often viewers scroll back to a specific slide during a session or in a subsequent session
- Navigation sequence: whether the viewer went forward in order, jumped ahead, or navigated back
Aggregate data across multiple viewers is more reliable than any single session. One investor spending eight minutes on the team slide might reflect personal style; ten investors averaging six minutes on the team slide is a structural signal.
Time on slide: what is long, short, and a skip
There is no universal benchmark for time on slide because deck design varies so much. A slide with a dense chart warrants more time than a single-sentence mission statement. Context is everything.
As a rough working guide based on industry data:
| Time on slide |
What it usually means |
| Under 3 seconds |
Skipped or glanced at, not read |
| 3 to 10 seconds |
Scanned, main message absorbed |
| 10 to 30 seconds |
Read carefully, some consideration |
| 30 seconds to 2 minutes |
Deep read, likely generating questions |
| Over 2 minutes |
Very high attention: complex content or a sticking point |
The "over 2 minutes" category is the most ambiguous. An investor who spent three minutes on your unit economics slide might be impressed and working through the math. Or they might be confused and trying to reconcile conflicting numbers. The session data alone does not tell you which. Follow-up conversation does.
The slides investors spend the most time on
Across pitch deck datasets, a consistent pattern emerges in which slides draw the most sustained attention:
- Financials and unit economics: investors check the math and the assumptions, and this takes time regardless of whether the numbers are good or bad
- Team: early-stage investors often make founder-first assessments, and the team slide gets disproportionate attention relative to its visual complexity
- Market size: TAM claims get scrutinized, especially if the number seems unusually large or the methodology is unclear
- The ask and use of funds: investors want to know what they are buying and what you will do with it
An investor spending 30 or more seconds on a market size slide is usually doing their own mental math or cross-checking your methodology. Pitch deck analytics and what investor attention patterns predict goes deeper on this.
Drop-off slides: what the data is telling you
A drop-off spike on a specific slide means a significant proportion of viewers are closing the deck at that point. This is one of the most actionable signals in your analytics.
High drop-off on slide one or two usually indicates a problem with the opening: the first impression did not earn the next click. This is often a design problem, a too-long title slide, or a problem statement that does not land immediately.
High drop-off in the middle of the deck, particularly around slides four through seven, usually means the deck lost the thread. The investor could not follow the logic from problem to solution to market to why you.
High drop-off after the financials can mean the numbers raised a concern that the rest of the deck did not answer. In this case, the fix is in the narrative surrounding the numbers, not the numbers themselves.
A drop-off on the final slide means almost nothing. Most viewers close the deck when they have seen enough rather than navigating to a blank last page.
Return visits and which slides they go back to
Return visits at the deck level are one of the strongest signals of investor interest (the SoF 2026 data puts the average at 2.7 sessions). Return visits at the slide level are even more informative because they show what the investor is still thinking about.
An investor who returns to your financials slide in session two but not session one is likely working through the numbers more carefully after a first read. An investor who returns to the team slide is probably verifying backgrounds or referencing the deck for someone else at their firm.
The slides that attract the most return visits across your viewer base are the slides doing the most cognitive work in your fundraise. They are also the ones to address proactively in your follow-up if you get a meeting: those slides will come up.
Navigation sequence: forward and backward patterns
Most tracking tools show you whether viewers navigated your deck in order or jumped around. Both patterns are informative.
A viewer who goes directly from slide two to slide nine is skipping your product slides entirely, which means either those slides are not earning their place in the flow, or this investor is making a quick thesis check before deciding whether to read carefully.
A viewer who scrolls back from slide seven to slide three, reads it again, then continues forward has encountered something in slide seven that raised a question answered earlier in the deck. If this pattern appears across multiple viewers, the two slides are not connecting well and the deck may need a clearer signpost between them.
Forward detection: what it means when your deck gets shared
Most tracking platforms log when a link is opened from a new device or location that was not present in earlier sessions. A second viewer appearing on the link is usually a forward: the original recipient passed the deck to a partner, an associate, or a co-investor.
A forward is a strong positive signal. It means the investor thought the deck was worth someone else's time. What happens when an investor forwards your pitch deck covers the internal review dynamics in more detail.
From a slide-analytics perspective, a second viewer often behaves differently from the first. The partner or co-investor may spend more time on the financials and team slides and less on the problem and market slides, because the analyst has already filtered for thesis fit. This pattern in the session data is a reliable sign that you are moving up the decision chain.
How to act on slide data before a follow-up
The most practical use of slide-level data is in shaping your follow-up message. If the analytics show high attention on the market size slide and quick navigation through the product section, lead your follow-up with market context rather than product details.
If the drop-off spike is on slide four, your fourth slide is your highest-priority rewrite before the next round of sends. Do not change the deck for every investor who drops off there, but if that pattern holds across ten or more sessions, the slide is the problem.
Combine slide data with open rate benchmarks to build a fuller picture: who is engaging, at what depth, and on which parts of the story.
FAQ
Do all pitch deck tracking tools provide slide-level analytics?
No. Basic tracking tools show open events and total view time. Slide-level data, including per-slide time, drop-off rates, and navigation sequences, is typically a paid-tier feature. If this data matters to your process, verify that the tool you are evaluating explicitly offers slide-level breakdowns, not just aggregate session data.
What does it mean if an investor spends a long time on my financials slide?
It usually means they are working through the numbers carefully, which is a good sign that the deck has passed the initial thesis screen. It can also mean the numbers are raising questions. The session data alone cannot tell you which. If you get a follow-up conversation, lead with a proactive explanation of the financial assumptions to address any questions before they surface.
How many viewer sessions do I need before slide-level data is useful?
A single session gives you directional information but not statistical confidence. At five or more sessions from different viewers, patterns start to become meaningful. At ten or more, you can be reasonably confident that a consistent drop-off or attention spike is structural rather than individual.
Can slide-level analytics help me improve a deck that is not getting meetings?
Yes, if you have enough sessions to identify patterns. Look first at where viewers are dropping off and which slides are getting skipped. These two signals together tell you where the deck is losing the room. The pitch deck analytics guide covers how to interpret these signals for meeting conversion.