
Pitchwise tracks exactly how every viewer engages with every page of every document you share. Here's how to read what you're seeing — and what to do with it.
Where to find your analytics
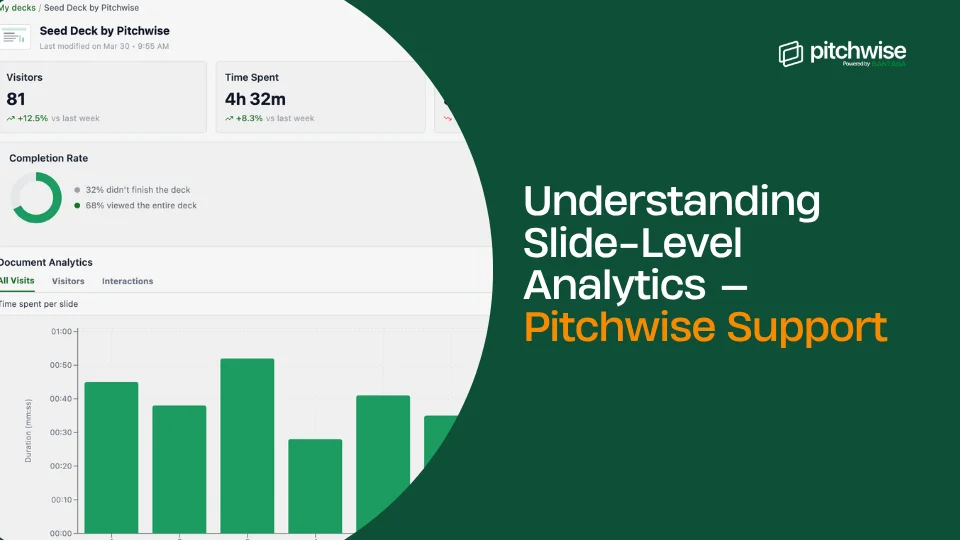
From My Decks, click any document to open its analytics view. At the top, you'll see four headline metrics; below that, the Completion Rate; and below that, the Document Analytics section with three tabs.
The four headline metrics
Visitors
Total number of unique visitors who opened the document. Includes the % change compared to the previous period.
Time Spent
Total time spent viewing the document across all visits combined.
Avg. Time
Average time per visit. A useful signal for how thoroughly people are reading – a 30-second average suggests skimming, and an 8-minute average suggests genuine engagement.
Downloads
Number of times the document was downloaded. Shows a dash if downloads are disabled on the link.
.png)
Completion Rate
The Completion Rate section shows what percentage of visitors made it through the entire document versus those who dropped off partway through.
Visitors who didn't finish the document
The percentage of visitors who stopped before the last slide.
Visitors who viewed the entire document
The percentage of visitors who made it through every slide.
Tip: A low completion rate isn't always bad — a short, punchy document with a strong early message might generate a call before the viewer finishes. But a consistent drop-off at a specific slide is a content signal worth investigating.
Document Analytics — the three tabs
All Visits
Shows aggregate engagement data across every opening of this document – the Page-by-Page Analytics chart, which displays time spent on each slide across all visits. Taller bars mean more time spent. Identify your strongest and weakest slides at a glance.
Tip: Hover over any bar in the chart to see the exact time and a thumbnail preview of that slide.
Visitors
Shows engagement broken down by individual visitor — but only when Email required or Email verification is enabled on the link. Without email collection, visits appear as anonymous.
For each named visitor, you'll see their total visit duration, number of visits, when they last visited, and their per-slide engagement for each individual visit.
Tip: Switch to the Visitors tab after sending your document to an investor or prospect. You'll see exactly who opened it, when, and how deeply they read it — information that completely changes how you follow up.
Interactions
Records any actions taken inside the deck view beyond passive reading — including call scheduling clicks and messages sent (if you enabled these CTAs in your link settings).
What do different patterns mean
Long dwell on one specific slide
The viewer is studying that section carefully. If it's your financials or pricing slide, lead your follow-up by offering to walk through that section in more detail.
Consistent drop-off at a specific slide
That slide is breaking engagement. Review the content and structure. It may be too dense, unclear, or ask too much of the reader before the value is established.
Very short average time (under 30 seconds)
The viewer may not have been ready to read it, or the full document may not have been uploaded by you. Consider verifying the document’s content or following up to check with the viewer.
Return visit after a gap
The viewer is back — this is one of the strongest engagement signals in fundraising and sales. Reach out now, not three days later.
Related articles
-> How to create a shareable link
-> How to manage link settings